Project 1: Exploratory Data Analysis for Girl Scouts
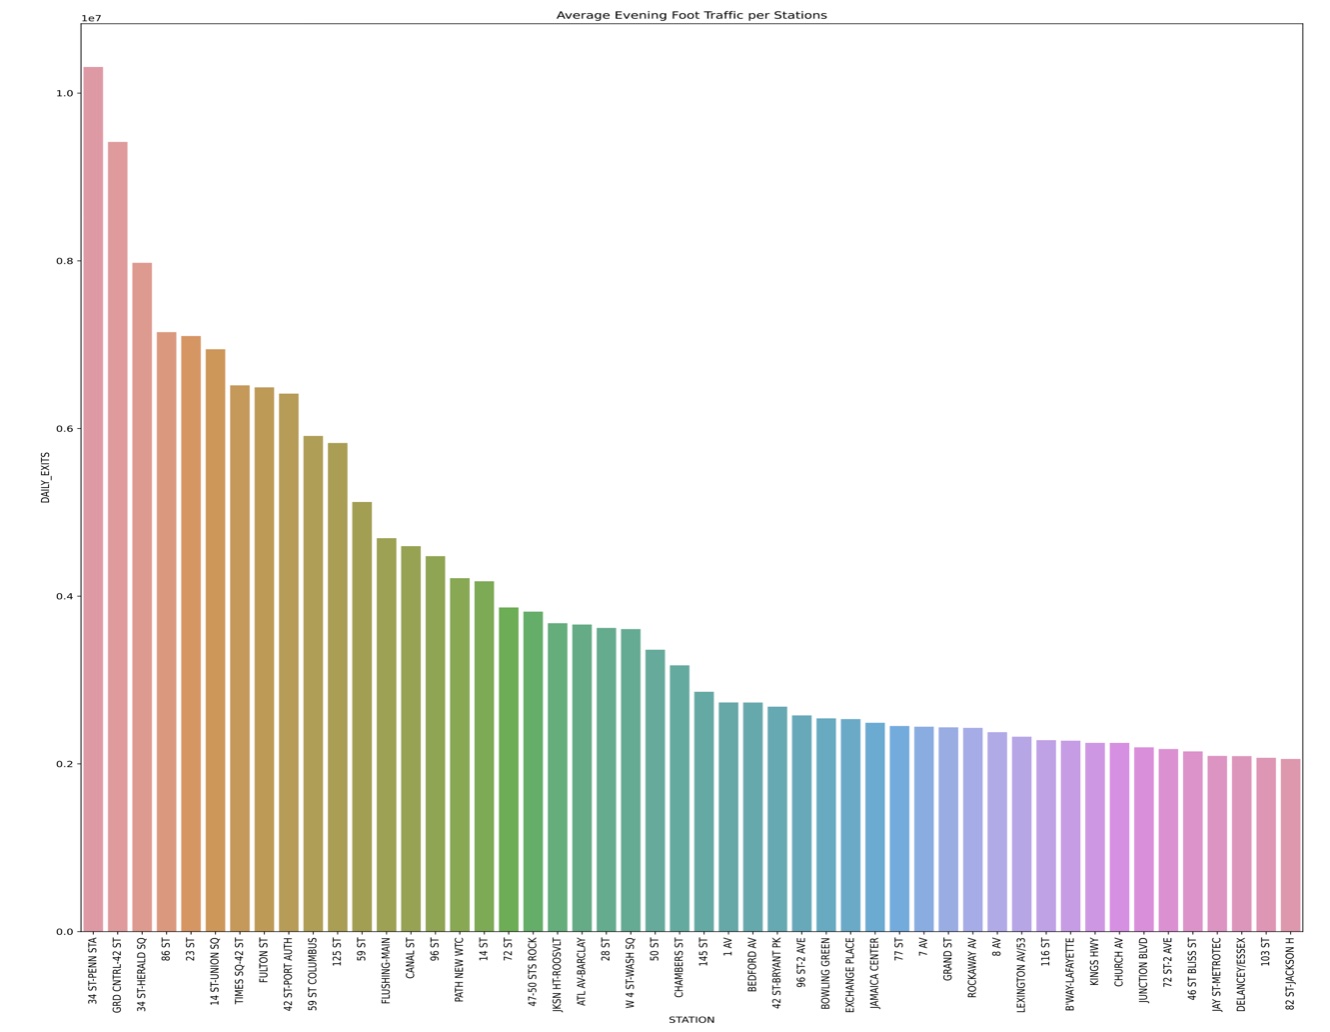
This project aimed to help a Girl Scout troop maximize their cookie sales by identifying the best NYC subway stations for their operation. The selection was based on the MTA turnstile subway data and Statistical Atlas’s Census data, focusing on stations with high foot traffic near family-oriented neighborhoods. Subway stations were chosen as the selling points due to their high foot traffic, and stations near family-dense areas were assumed to yield higher sales....

Project 2: Linear Regression Model for Chris Paul Player Statistics
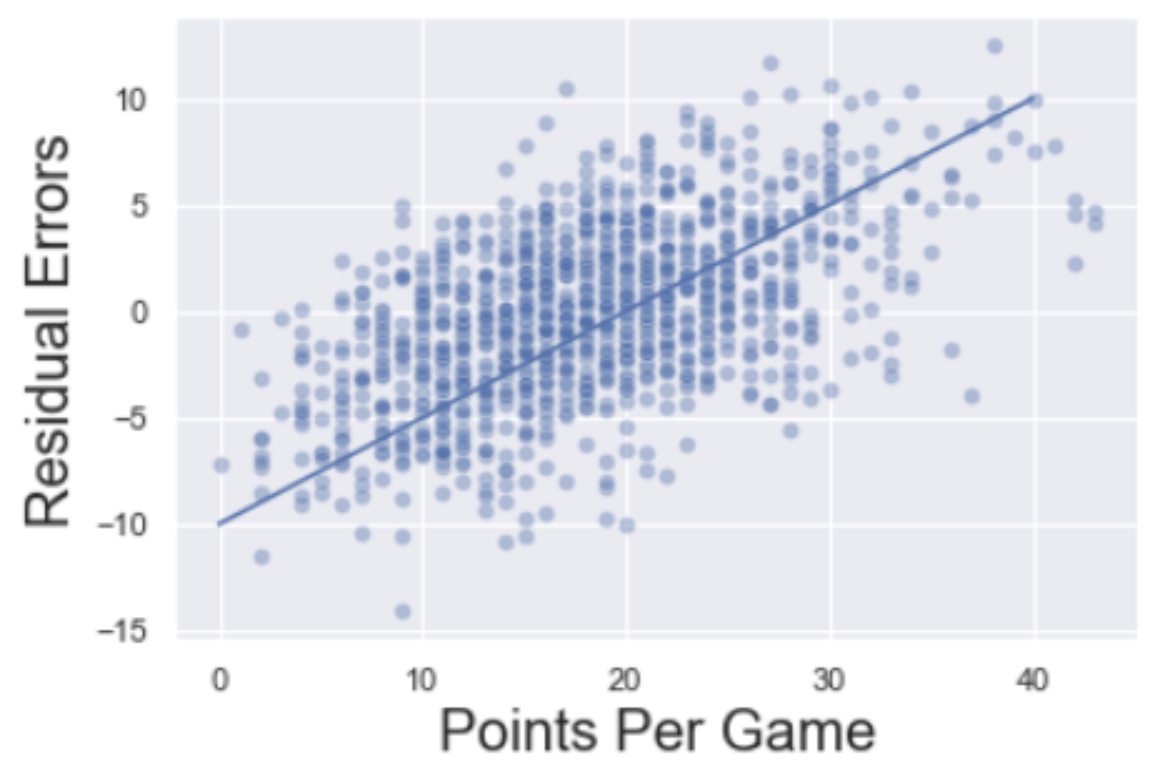
The project aimed to build a model to help Chris Paul, a professional basketball player, identify the statistics that most influence his offensive ability, particularly points scored per game. Over 1,000 rows of game statistics were scraped from Chris Paul’s page on Basketball Reference to build a linear regression model. The model was designed to provide interpretable and actionable insights that Chris Paul could incorporate into his playing strategy. The data collection involved scraping per game statistics for Paul’s entire career, totaling 1155 regular season games....

Project 3: Classification Model for Miami Real Estate Market
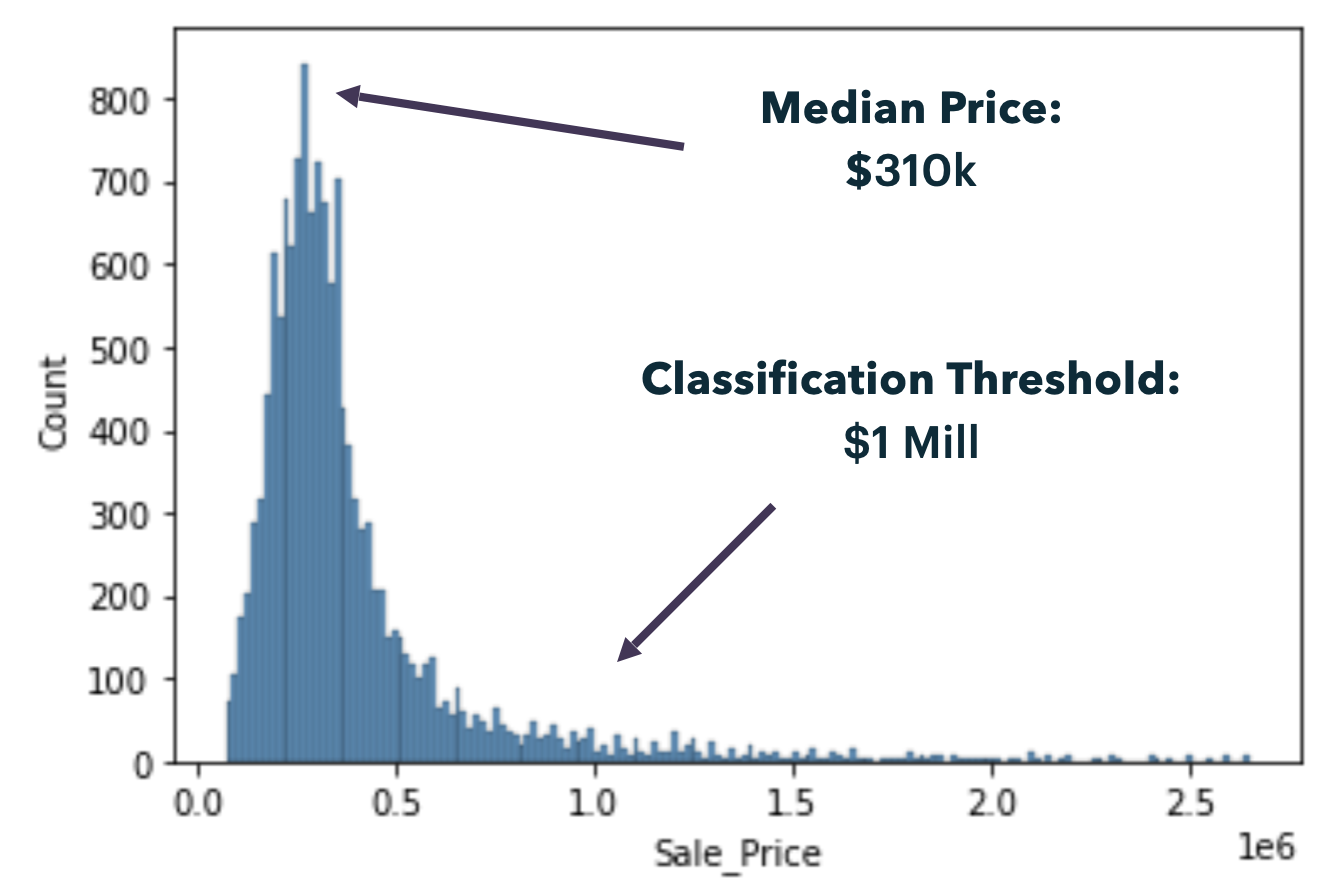
The project aimed to create a classification model to help a Miami real estate agency improve its client management process by distinguishing high-valued clients from normal clients. The agency wanted to restructure their service to provide better-skilled agents and improved customer experience for high-valued clients, defined as those with property values above $1 million. The classification model was designed to predict whether a potential client would be high-valued or normal based on the property’s features....

Project 4: Twitter Recommendation Alogorithm
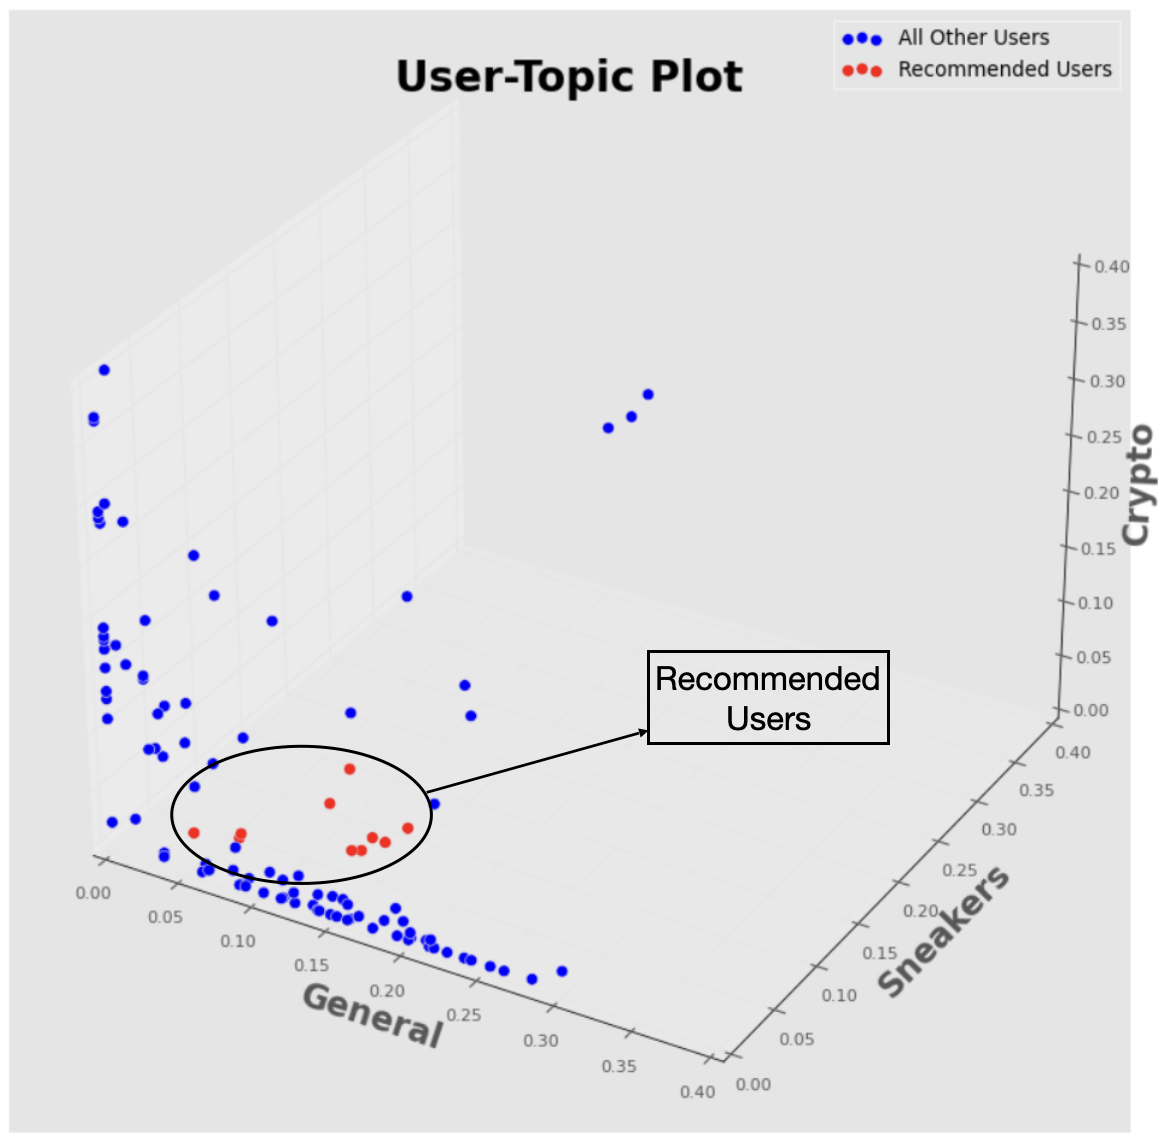
The project aimed to build a recommendation model to suggest 2nd degree Twitter users to follow based on collective tweets, retweets, and likes. Approximately 19,700 tweets from 106 different Twitter accounts were scraped using Twitter’s Tweepy API. Natural language processing, topic modeling, and distance calculations were used to determine the top 10 most similar accounts based on the user’s Twitter preferences. The project began by collecting up to 100 tweets/retweets and 100 likes per user, compiling the data into a data frame, and cleaning the data....